Analytics Boot Camp: Day Two – Home Tab, Continued
Ahoy, Boot Campers!
Welcome to Day Two of our Google Analytics Boot Camp.
Today, we’ll continue exploring the Home tab on the Analytics administrative dashboard – specifically, Real-Time tracking.
One of our favorite features of Analytics is the Real-Time tracking; this shows you active users on your site Right Now, where they came from, where they are located geographically, what they’re looking at, and how many pages have been clicked in the last 30 minutes. It’s terribly, terribly spiffy.
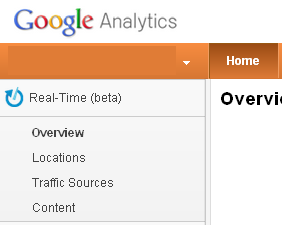 To find the Real-Time tracking mode, log into your Analytics Admin dashboard, click the Home tab in the top left corner, and then click “Real-Time (beta)” from the navigational menu at the left.
This will take you into the broad overview of the real-time metrics, which is where we spend more of our time, as it gives us the most information.
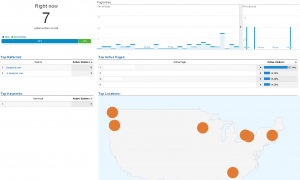
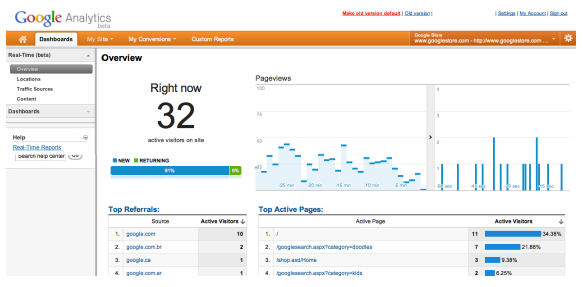
You can click the small graphic below to open it full-size in a new tab or window; this will show you what the overview looks like on the whole, and we’ll break it down into smaller bits like we did in Day One on Friday.
Popular websites will have more exciting information than we’ll be presenting from our humble website. This site, for example, has 32 visitors, compared to our seven:
But we gotta use the data we have, so you’re stuck with our boring numbers! Our apologies.
Right Now
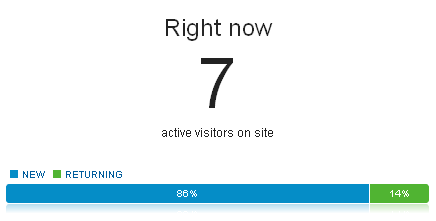
The top right corner, which is labeled “Right now,” shows us how many visitors have been active on the site within the past 5 minutes. It also gives a snapshot of what percent are new visitors, and how many are returning visitors.
Top Referrals
The data immediately below is labeled “Top Referrals,” and shows you from where the visitors are coming:

Here we see we have five visitors from FaceBook’s standard website, and 1 visitor from FaceBook’s mobile interface. Clicking on the label takes us into the Traffic Sources overview, which gives a complete overview of all active traffic sources. This view includes the “Referral Path,” or the actual source file/link the user clicked upon. For FaceBook, this will usually be “/l.php.” For other sources, it will vary. This can help you track down posts from other websites where you have been mentioned.

Top Keywords
If visitors arrived upon your site via a search engine, the keywords they used will be shown in the Top Keywords area, which is directly beneath Top Referrals. Clicking on the lable will take us into the Traffic Sources overview, where more information is displayed.
Keywords will not always be displayed if, for example, visitors arrived from a non-search-engine site, or if the search engine did not provide the keywords.
Two of our visitors came from Google, but only one shows us what keywords brought them to the site. Sadly, we can’t force Google to share everything all the time.
Pageviews per minute/per second
This is a very handy metric, showing us how many pageviews each visitor is accumulating. If we have 10 visitors only looking at one page, we’re perhaps not engaging our audience very well, or encouraging them enough to read additional posts. As we discussed in another post, though, it’s important not to get too hung up on pageview numbers if you have a lot of return readers who are current on your older content; maybe they only need to read the latest post before leaving.
However, if you are trying to encourage readers to click around, this is a great way to see how well that’s going.
On the left side of this metric is the “pageviews per minute” view, and on the right, the “pageviews per second,” where you can actually see the real-time stuff happening. Each time a reader clicks arrives on your site or clicks to another page on your site, you’ll see their clicks scrolling by on that right portion.
As readers click, their stats will accumulate (usually on the left side, as most readers don’t click more than once per minute.) You can see in the above graph, some readers just looked at one page, some two, and one looked at about seven. You can see three active clicks on the right-hand, per-second side.
If you have steady traffic, it can be fun to just sit back and watch the visitors flow over the site.
Top Active Pages
This metric shows us which pages are being read, and by how many.

Clicking the label takes us into the “Content” overview, which allows us to see what content people are reading most.
On the “Content” overview, the graph shows us more source information besides “New/Returning;” we now see “Direct/Organic/Referral.”
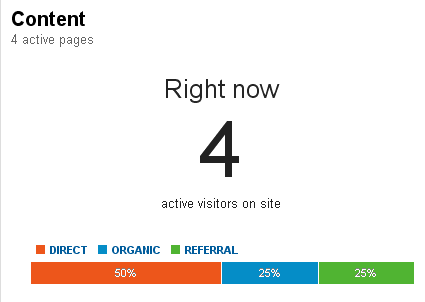
As we’ve discussed previously, “direct” traffic is people who type your URL into their browser directly, or who use a bookmark. “Organic” traffic comes via a search engine and keywords. “Referral” traffic originates from another website linking to yours.
Sometimes, links like this will show up:
![]()
The “/outgoing/” prefix tells us this is an outbound link – someone leaving the site, and where they were headed.
On the “Content” overview, on the bottom portion of the screen, we see this:
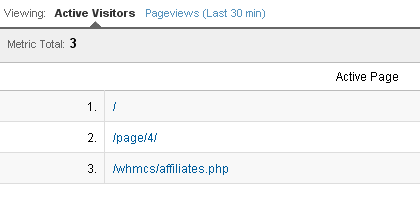
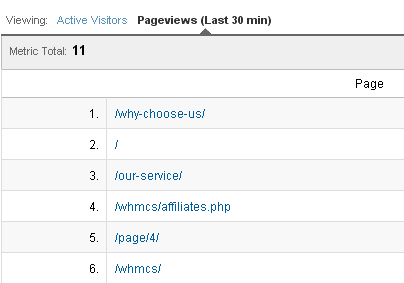
The default view is the “Active Visitors” view, which shows us (strangely enough) what active visitors are looking at. Next to the “Active Visitors” view is “Pageviews (Last 30 min)” in pale blue – easy to overlook – which shows us exactly what it promises; which pages have been viewed in the last thirty minutes. This view includes both active and inactive viewers.
Top Locations
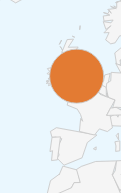
This is another really neat metric, showing you from where in the country (or in the world) your visitors are connecting. Here’s one view showing a visitor from England:
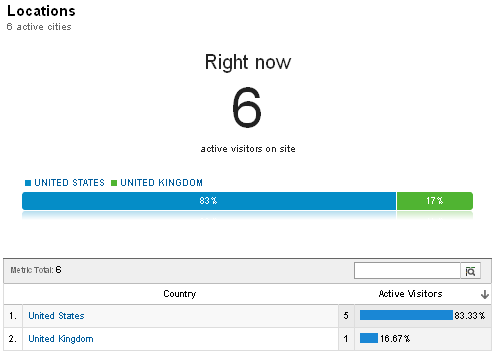
Clicking on the Top Locations label takes us into the “Locations” overview, which lists visitors by location:
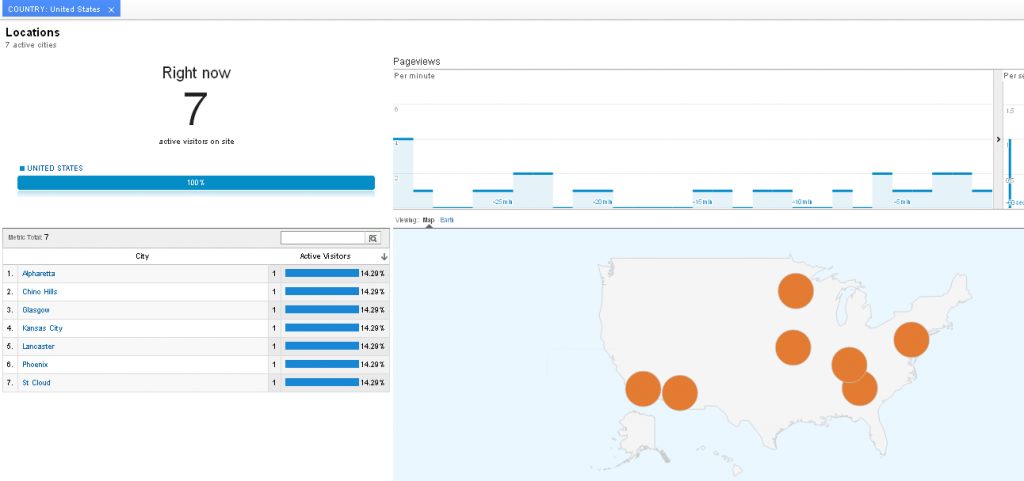
Clicking a country on the map or in the list will bring up active visitor information for that country (click for larger view:)
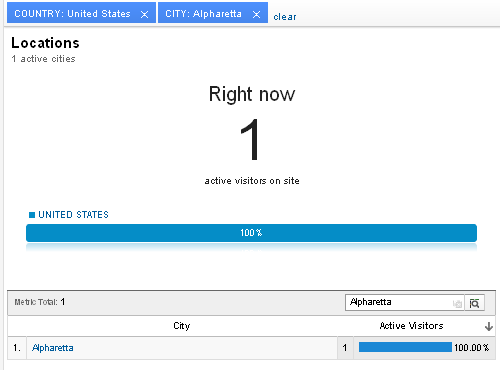
Clicking on individual cities brings up information from visitors there. Notice the filters at the top of the screen in blue boxes:
When a filter is applied, the data shown is only for that filter, and excludes everything else. Clicking the “x” next to each filter will clear it to include more results. Clicking the “clear” link next to the filters brings all data back into scope.
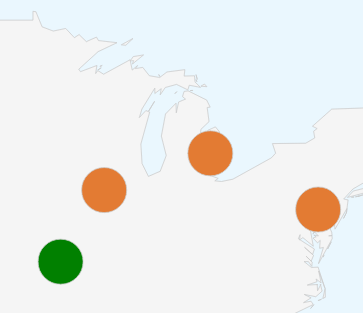
If you happen to be watching your locations map when a new visitor arrives, Analytics will flash their location green briefly to draw your attention to the new visitor. Likewise, when a visitor in a location either times out or surfs away, they will briefly flash red, then disappear.
In the first segment of today’s Boot Camp, we talked about the Real-Time tracking information provided by Google Analytics.
We realize these Boot Camp posts are on the lengthy side, so we’ll be back later this evening with a second installment to help keep things shorter per post. In the next section, we’ll talk briefly about using Real-Time tracking with your social campaigns, and then move on to Intelligence Events, and why they do not relate to national security.
Stay tuned, and thanks for tuning in!

