Analytics Boot Camp Day 5: Visitors Flow
Hello, Campees!
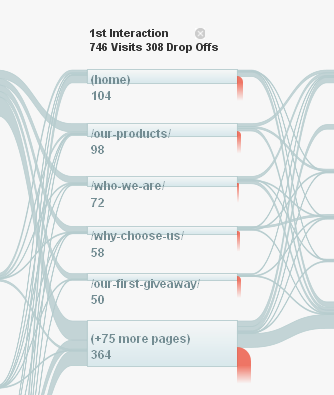 Today we’re going to show you our second-favorite Analytics area, Visitors Flow. This informative screen only falls behind Real-Time track in terms of nifty-ness in our view. Erin is partial to the image to the left, because it reminds her of nerves coming out of a human spinal column (she is a little bit of an anatomy geek.)
To help us set up our Boot Camp today, let’s see what Google says: “Visitors Flow is a graphical representation of the paths visitors took through your site, from the source, through the various pages, and where along their paths they exited your site.” Neat!
This graph shows “nodes,” which are one metric of the dimension with which we’re filtering (see, you know what that lingo means now!) or a single page/collection of pages, and “connections,” which represent the path taken between nodes.
Google has a fairly nice help section about Flow, including how to Analyze and Troubleshoot it.
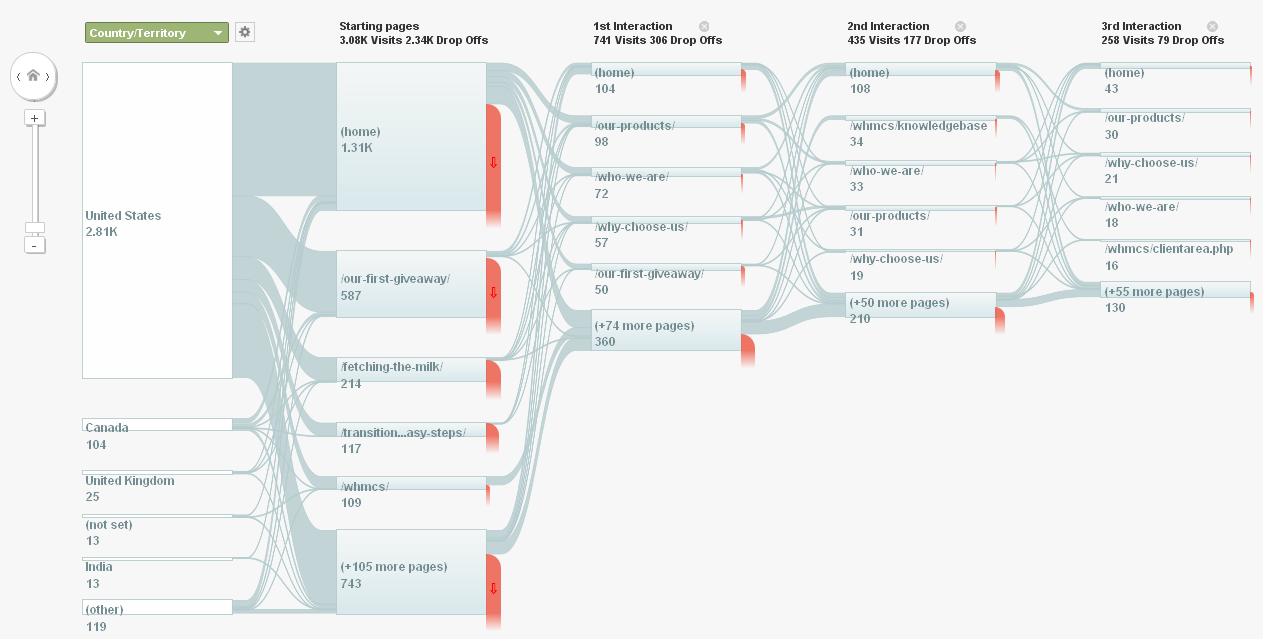
Here’s the Visitors Flow from our site (click to view larger in new tab/window: )
The default view filters by Country/Territory, so that’s what we’re seeing. We can use the scale adjustment tool at the top left to increase or decrease the size of the chart. Additionally, clicking on the “home” button at the top of the scale selector will take us all the way back to the beginning of the report after we’ve scrolled to the right (we were only able to fit this much on our screenshot, but it scrolls farther off to the left, up to the 12+ interaction level.)
Neat stuff, huh? The connections show where people browsed next. We can see in our example when people landed on Black Chicken Host’s Home Page, 98 went to the Our Products Page, 72 went to the Who We Are Page, and so forth. Of the 98 who went to the Our Products Page, 34 went to the Who We Are Page next.
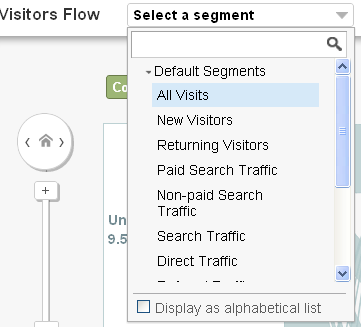
We can change the segment (by default set to All Visits) by selecting the Select a segment dropdown menu.
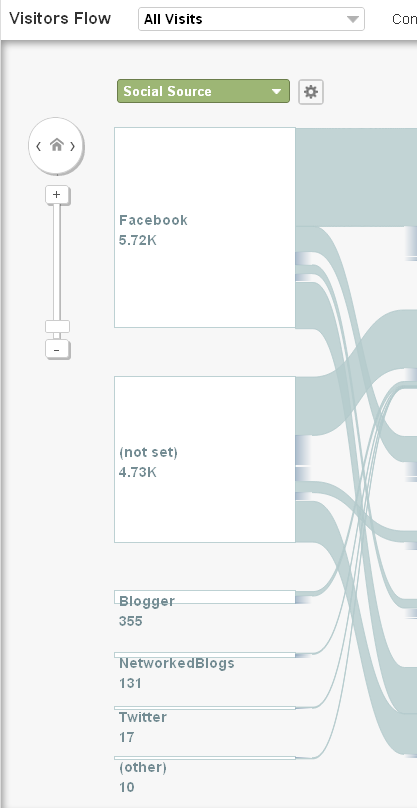
Interesting ways to use this menu include seeing where your return visitors are going, where new visitors are going, and where your search traffic is going. We can change the default Country/Territory dimension (green dropdown) to something else nifty, like Social Source, which shows us from which social networks people have come.
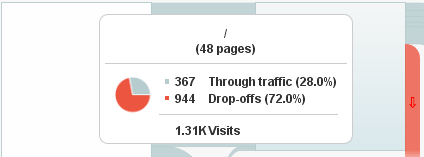
Mousing over any portion of the graph will result in a pop-up describing that node or connection.
Whereas clicking will bring up another menu, allowing us to highlight or explore traffic paths, or show the details of the group in the area upon which we clicked.
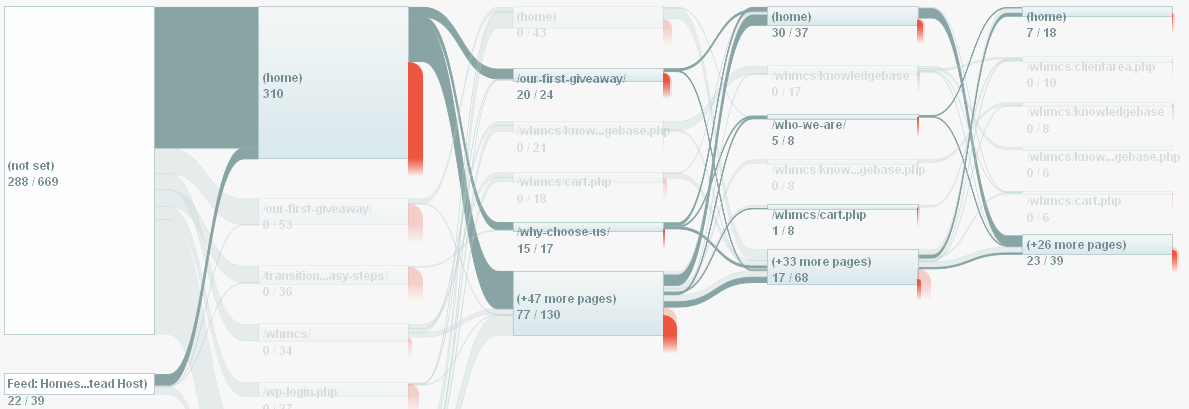
Here’s what highlighted traffic through our Home Page looks like (shown in the darker blue-green color.) This shows the routes people took after visiting the Home Page:
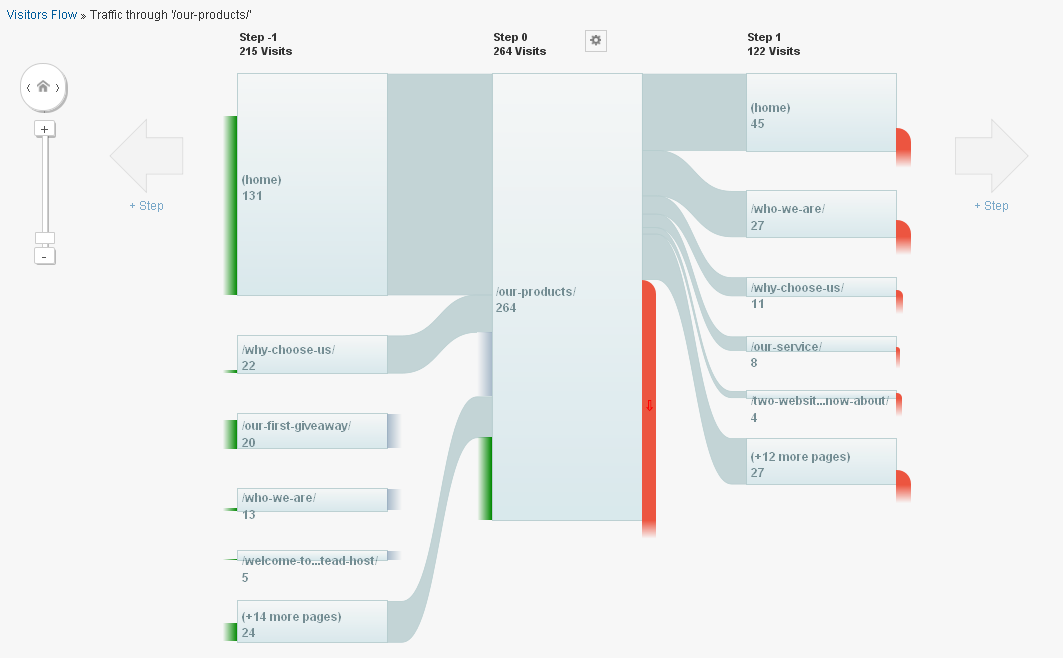
If we explore the traffic passing through Our Products, we see this, which shows traffic coming into the Products Page as green, and drop-offs as red. Drop-offs are people who timed out or who actively left the site.
Of the 264 who went to the Our Products Page during our time frame, 45 went back to the Home Page. When we mouse over the (home) area, we see this:
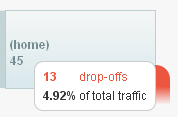
This tells us 13 visitors dropped off from there, which accounted for 4.92% of all traffic.
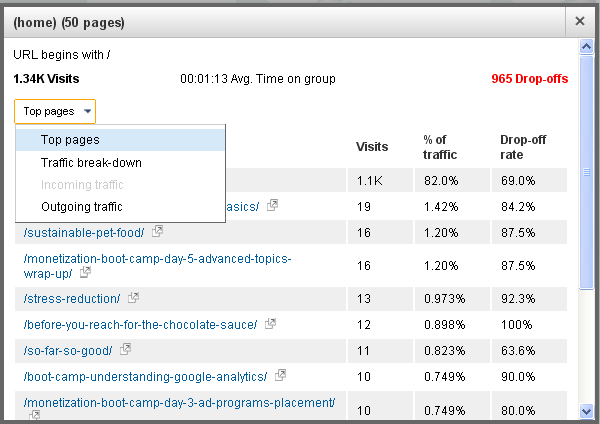
And finally, clicking on Group Details yields a pop-up screen where we can explore aspects of the visitors for the node and time period we selected.
Using all of the terrific vocabulary and skills we’ve picked up throughout this Analytics Boot Camp, we can pick and choose dimensions and metrics to view how readers are using our site, compare it to how we intend readers to use the site, and consider what we want to do with the new information: Change the vision for the site to match what readers are trying to do? Do nothing? Try to entice readers to use the site as you envision via some other method? This is your site – you can do whatever you like!
Try not to be discouraged if people aren’t using your site as you intended – the internet is constantly confounded webmaster and bloggers alike with its shenanigans. The good news is, people are using your site.
Ta-ta for now!
That’s all for the early segment of today’s Analytics Boot Camp. If you have any questions, please let us know! Are we going into too much detail? Not enough? We’d love to hear from you.
Next up – A brief look at using Google Analytics to track your AdWords advertising.

