Analytics Boot Camp: Day Two, Part Two
We’re back, Boot Campees!
In the second installment of today’s Boot Camp, we’re going to briefly discuss how Real-Time tracking can be useful (and fun) after you do a social media campaign, and then move into the next area of the Google Analytics (GA) Home tab – Intelligence Events.
If you participate in social media networks, such as FaceBook, Twitter, et cetera, you can see what impact broadcasting your URL’s has on traffic. While link trackers (such as bit.ly) can help you track how many people clicked a given link, GA’s Real-Time tracking lets you see how quickly people are coming into your site via that link, where they click around, and when traffic from that campaign begins to wear off. Seeing when traffic dies down after a broadcast can help you determine when to reengage your audience with a new social media broadcast or campaign.
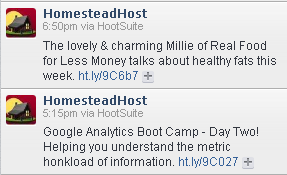
Earlier today, we used HootSuite to post two updates – one for the first part of today’s Boot Camp, the other to promote Millie’s guest post about healthy fats, and then we watched our GA Real-Time metrics.
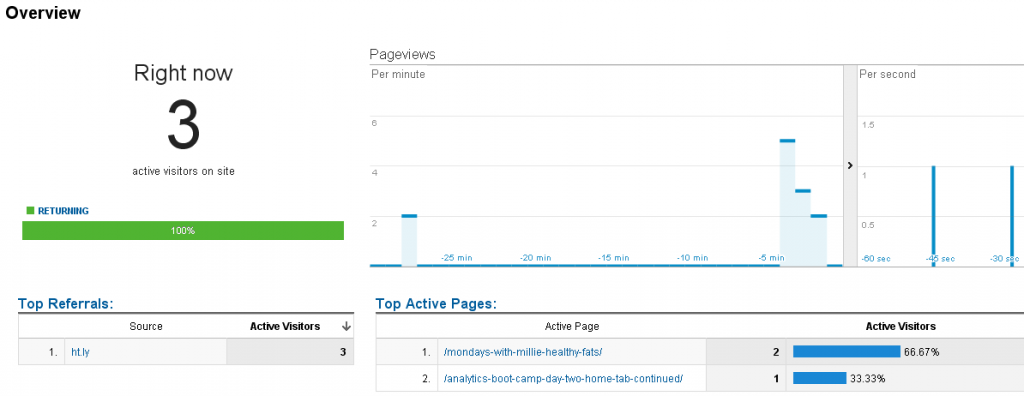
A moment later, we started to see traffic coming in on each link:
After a few minutes, we had received 12 hits from our posts:
If you have an active social network following, your numbers will likely be higher than ours. 🙂 When traffic begins to decline, you may wish to consider publishing another update to keep people interested; however, spamming the same link over and over again will likely annoy your followers.
If you have any questions about Real-Time tracking within GA, please feel free to leave your question in the comments, or to use our Contact Form.
Thus far, we have not covered any truly horribly mysterious ground. Next up, though, is a topic many folks have no idea what to do with:
Intelligence Events
Now we’re getting into at least slightly unfamiliar territory for many casual GA users. What in the stinkin’ heck is an “Intelligence Event?”
Let’s hear it from Google themselves:
“Analytics Intelligence monitors your website’s traffic to detect significant statistical variations, and then automatically generates alerts when those variations occur. Taking a closer look at these anomalies can provide insights you might have otherwise missed, for example, a spike in traffic from a particular city or referring site.”
Keen!
Let’s have a look.
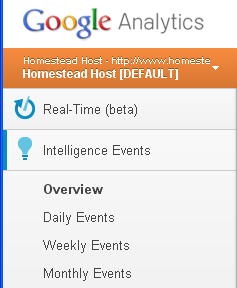
We find Intelligence Events on our Home tab, beneath the Real-Time menu. Clicking on it expands a drop-down, which includes the overview, as well as Daily, Weekly, and Monthly Events.
Our Intelligence Events overview looks like this right now (click to view large enough to read in a new tab or window: )
(Your Intelligence Events will look different from ours, very likely, as different triggers have occurred on your site. )
If you click on that image, you’ll notice there are several metrics with the same name (eg, Bounce Rate, Avg. Time on Site, et cetera.) That’s because Google logs each event – there isn’t one metric it’s tracking on this screen… it’s tracking changes in metrics. Thus, each entry here represents an anomaly (positive or negative) which might warrant investigation.
In our case, all of our triggers were good things – traffic and time on site expectations exceeded, et cetera. This is because our site is new, and Google is still learning what to expect from our traffic. It is normal to have some red, potentially negative reports, as shown from this anonymous site (click to view larger: )
When we launched our new design last month, we completely threw Google’s expectations off, as shown by the following example log entries:
Because our traffic had been low before we launched, Google expected our traffic to be at a certain level, but we exceeded those levels by greater than 500% – Surprise, Google!
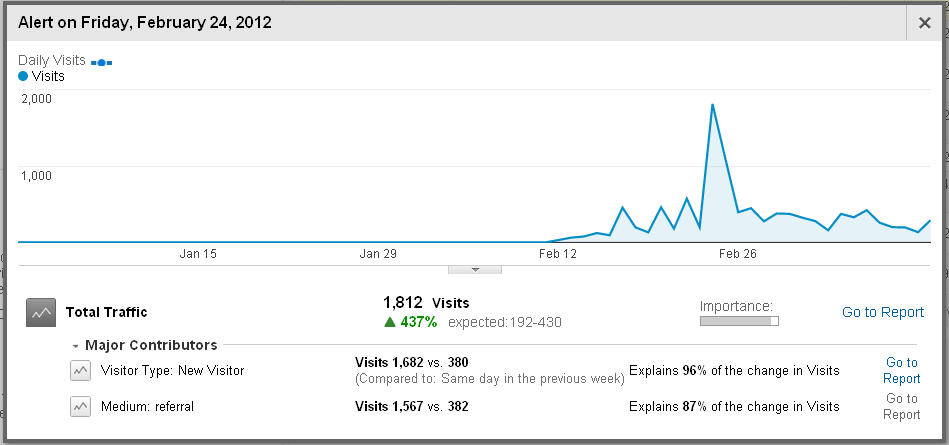
Next to each alert, all the way to the right, there is a “Details” link, which will pop up a more expanded view of the time period involved.
This report shows us information about the event, and why they think the anomaly occurred. It’s pretty impressive. Additionally, in the bottom right of many of these pop-ups, there’s a “Go to Report” link, which will provide even more detailed information about what happened.
You can configure email and cell phone notifications for your alerts to keep on top of what Google thinks is important.
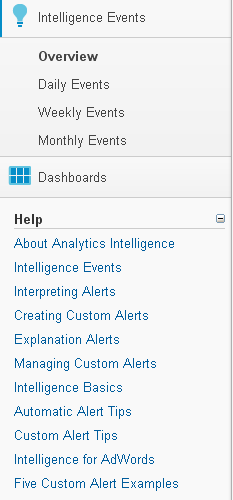 Google’s Help section (beneath the Intelligence Events menu) for this topic exceeds the others – we feel they do a good job explaining the ins and outs of Events. They even have an Analytics Intelligence video to help users understand how it all works. We highly recommend viewing this video, as it covers everything nicely and explains how to set up custom alerts.
As such, we won’t cover everything in detail here. However, we want to explain some key concepts, and point you to some good resources for further information:
Dimensions: These are available metrics to use in Events. You can see a full listing here.
Creating custom reports: There’s a great page here covering this, and it includes another video.
Alert Conditions: An alert condition is triggered when the metric set up for your dimension reaches its threshold. Reading that sentence over, we realize it’s very Buzzwordy, which is the problem we’re trying to surmount. Let’s break it down into more understandable terms. Say you want to know when your Daily Visits hits 3,000. The dimension there is Daily Visits, and the metric is how many daily visits there are. When the metric hits 3,000, the alert condition is triggered. Does that make more sense?
We named the alert something useful and appropriate, set the period to “Day,” and we asked GA to email us when the alert occurs. Next, we configure what conditions will trigger the alert:
That’s a very basic Alert Condition. We can make them more complex (click to make bigger in a new tab/window: )
Thus, in a nutshell, an “Alert Condition” is just an Event. Google has a set of events it monitors for automatically, and you can set up custom events/alert conditions.
You could set up custom alert conditions for your landing page’s bounce rate (remember, that’s the percentage of people who read one page and leave your site,) for traffic spikes, for sales decreases, for paid traffic going up or down – there are a plethora of ways to make GA work for you in ways you’ll find useful!
We feel the most difficult part of navigating the Intelligence Events area is understanding the lingo used, and we hope the explanations and resources we’ve outlined here are of use. Please let us know if you’d like to see more detailed information – we’ll be happy to oblige.
Tomorrow’s Agenda
In tomorrow’s camp, we’ll begin tackling the Standard Reporting tab, which lives to the right of the Home tab in the GA Admin Panel. There is a lot of terrific information to be had here, so stay tuned! We’ll catch you tomorrow; good night, Internet!

