Boot Camp – Understanding Google Analytics
Well hello there, Google Analytics Boot Campees!
When you look at your Google Analytics Dashboard, does your heart sink, your eyes glaze over, your brain feel a little overwhelmed? We completely understand. There is a metric honkload of information presented, and not always in particularly intuitive ways. Too, we find much of Google’s Help section for Analytics pretty unhelpful for beginners.
That’s why we’re here!
We’re going to walk you through the broad strokes and finer points of understanding Analytics, and using it to understand how people are accessing and using your site. While we can’t go into every possible custom report available, we’ll give you enough information and resources to strike out on your own and discover new Analytics territory.
We weren’t going to start this boot camp until Monday, but we wanted to give everyone a chance to get signed up for Google Analytics. Today’s session shows you how, and will let you know how to interpret the basic information you’ll start seeing over the weekend (if you’re not already using Analytics, that is.)
Let’s start with the basics.
What is Google Analytics?
Google Analytics (henceforth GA) is a free, powerful service which provides detailed statistics about a website’s visitors: How they found the site, what pages they looked at, how long they looked, on which page they exited your site, and so much more.
How do I sign up & get started?
To sign up for GA, you need a Google account; if you don’t have a Google account, you can sign up for one here. Once you have your main Google account, go to the GA Landing Page, and click the “Sign Up Now” link beneath the Access Analytics button:
On the next page, enter your Google account information. On the page after that, click “Sign Up.”
On the next page, pick an Account Name – we use “Black Chicken Host” for ours. It makes sense to pick a name that’s easy for you to recognize, and which is appropriate for your website. Enter your website’s URL, selecting the appropriate prefix, either “http” or “https.” If you’re not sure which to use, select “http.” The “https” option refers to site which are using a Secure Socket Layer certificate (SSL,) and if you had one in place, you’d probably know.
The “Not a website” option will not be covered in this boot camp, but GA is able to track certain properties that are indeed not websites.
Next, select your time zone.
Under the Data Sharing Settings, click the “?” next to the header, read over the options, and select which one you prefer. Because we are interested in improving Google’s products, performance, and so forth, we share our data with Google. This also enables additional features within the GA interface. We choose not to allow anonymous sharing with third-party services.
Next, read over the User Agreement, make sure nothing sticks in your craw, and click the “Yes, I agree to the above terms and conditions” box. Click “Create Account” and you’re in!
For the next images, we are not using our actual GA Tracking ID – we prefer to keep that private. This is a test account we’ve set up for the purposes of this tutorial.
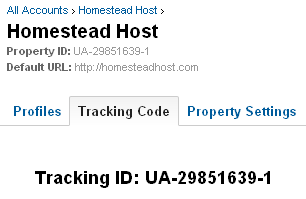
After completing signup, further configuration is required to use GA. The page subsequent to signup is your Admin Panel. Here, you’ll receive your unique Tracking ID, which is how GA identifies your site.
This Tracking ID needs to be placed onto your website before GA may start tracking your statistics. It also prevents random people from being able to set up a GA account to monitor your site without your permission. The ID needs to be placed on every page you want GA to track.
Thankfully, there are a number of WordPress plugins which will handle this for us. We currently use Google Analyticator, and Homestead Geek uses Ultimate Google Analytics. We’ll go over their basic functionality a bit later in the post. First, let’s finish getting you set up.
You have your Tracking ID, and now you want to tell GA what you’re tracking. You’ll do this on the same page where you received your ID.
For most websites, one of the top two buttons will work. If you are only tracking a domain with only one subdomain (a “subdomain” is the letters which appear before the domain, like “www” “store” “secure” “mobile” and so forth,) the first option will work. You can use this if your site uses only the domain.tld (“tld” is the Top Level Domain, such as .com, .net, et cetera,) or only www.domain.tld. If you use both www and non-www, or if you have additional subdomains set up, use the second option. Use the third option only if you wish to track multiple tlds in this one account (domain.net, domain.com, domain.co.uk, et cetera.) You may also track AdWord campaigns by clicking the box to the right.
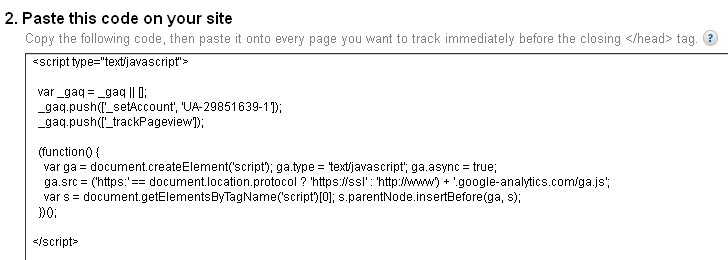
Once you have selected the type of property you’re tracking, code will appear in the bottom box. If you’re using WordPress, you do not need to copy that code – your plugins will generate it automatically. The code will look like this, and GA provides basic instructions for where to insert the code if you’re doing it manually:
After making all of your selections and entering all data, click the Save button at the bottom of the page.
How can I easily integrate GA into WordPress?
 Let’s talk about how to configure your WP plugins to help you get GA going on your site. Ultimate Google Analytics is the easiest to configure, in our opinion. After installing the plugin on from your WP administrative dashboard, you’ll have access to a new item under your Settings menu called Ultimate GA, as shown to the left.
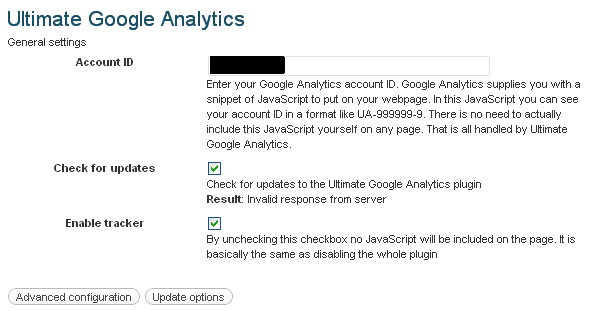
The basic configuration is adequate for many installations, and is shown here:
The Account ID field is where you’ll place the full Tracking ID, including the letters, dashes, and numbers. From our example, it would be UA-29851639-1, but you’ll enter your own.
The next field pertains to the UGA plugin itself, and is offering to automatically check for updates to the plugin. We recommend checking it.
“Enable tracker” is what actually turns on the GA functionality within your website. This must be checked in order for GA to work.
The Advanced configuration option is beyond the scope of this boot camp, but is not wildly difficult to understand. We’d be happy to answer any questions you may have in the comments.
When adding or changing information on these screens, be sure to click the Update options button at the bottom of the screen to save your configuration.
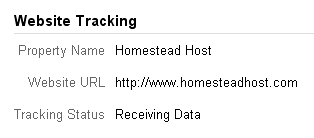
After enabling the UGA plugin, GA will be able to verify the Tracking ID and will begin gathering statistics about your site immediately. When you go back into your GA Admin panel and reload the screen, you should see the following:
Compare this with the result when the Tracking ID is not found:
The Tracking ID should be picked up almost immediately – you may need to refresh your GA Admin screen for it to appear.
What else should I do at this point?
We also recommend enabling Google’s free Webmaster Tools, which will allow you to gather more data about your website’s traffic. You may skip this step for the time being if you’d like, and come back to it later. There are several steps involved to enabling the Webmaster Tools.
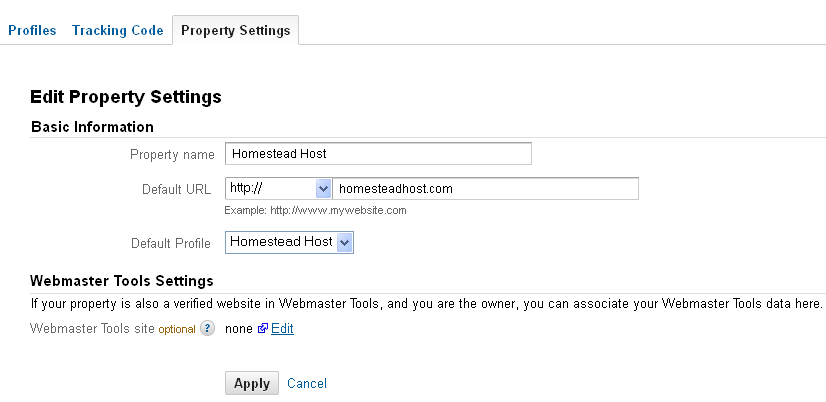
You can enable Webmaster Tools within your GA Admin panel. Click on the Property Settings tab above your Tracking ID:
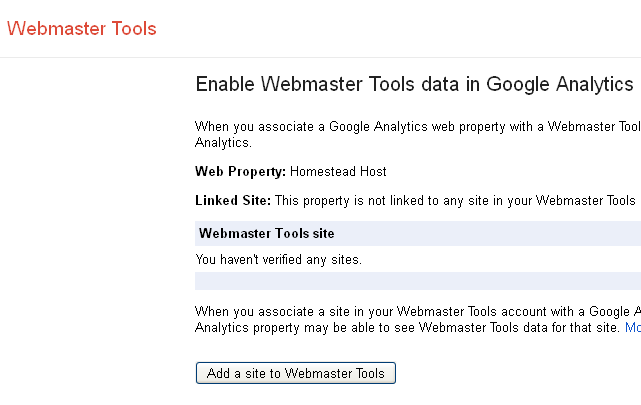
Under the Webmaster Tools Settings, click the Edit link next to the “Webmster Tools site (optional) none” line. Authenticate with your Google account on the next page. You’ll see something like this on the following page:
Click the “Add a site to Webmaster Tools” button to do just that. You’ll see a pop-up appear:
Click the OK button to proceed.
On the next page, you’ll see this:
Click that. 🙂
Enter the URL of your site, without the http:// in front of it; for example, blackchickenhost.com or www.blackchickenhost.com. Click “Continue.”
On the next page, you’ll be asked to verify ownership of that site. This is for your protection and prevents unauthorized parties from being able to access Google’s Webmaster Tools for your site.
Their recommended method is quite simple. They’ll offer a file to download to your computer and then upload into your website’s main html folder. For Black Chicken Host customers, you would put it into your Document Root folder, which is /home/yourcPanelusername/public_html. If you have questions as to how to FTP this file into your public_html directory, please open a support ticket.
After you have placed this file into your public_html folder, click the Verify button, and Google will try to access the file. If it is successful, Tools are enabled! This file needs to remain on your site, as Tools will continue to access it to verify you own the site.
If their attempt to verify the site failed, you’ll see something like this:
Make sure the file is indeed in the correct folder. If you continue having troubles and are a Black Chicken Host customer, please contact support and we’ll assist you. Or, you can try one of the other verification methods. Try using your Google Analytics account next, as that’s fairly simple.
For now, we’re going to ignore the rest of the GA Admin panel, as the other options are more advanced, and we just want to get going, right?
Ok!
Basic Dashboard Information
We’ve signed up for GA and Webmaster Tools, and have installed a plugin into our WordPress interface.
Now, how the stinkin’ heck do you make sense of the data you’re seeing? What’s an Intelligence Event? What’s a Total Goal Conversion Rate? That’s all coming up.
One important note: GA only updates the reports once every 24 hours (real-time metrics excepted.) When you first sign up for your account, no data will show up until the next day – data is processed at midnight in the local time zone. We know – we hate waiting, too! But fear not – we’ll show you what our stuff looks like, so if you’ve just signed up for your GA account, you can still read along and be fully-prepared for the data you’ll see in the morning.
Let’s look at our main GA Dashboard, which you can find by clicking on the Home tab near the top left corner and prepare for information overload (for now:)
We can’t fit the whole dashboard into a readable image here, so we’re going to take each chart which appears piece by piece. All information shown on your dashboard will be for the dates shown in the top right-hand corner.
You can change the dates by using the gray drop-down arrow:
Please note: Your Dashboard may have its widgets in a different order.
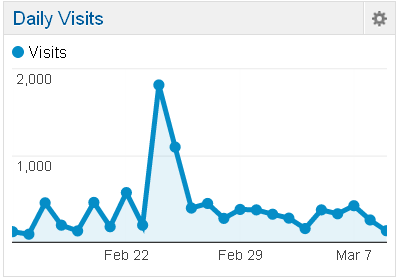
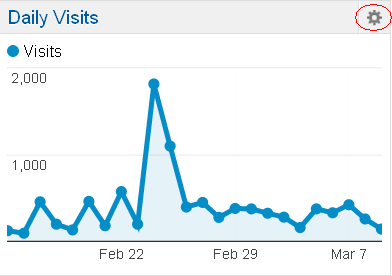
Daily Visits
The Daily Visits chart gives you a quick overview of how many people visited your site during the date range you selected.
You can click on the title of the chart for a more detailed analysis of the information presented, including a larger graph, a breakdown of visitor information, and more:
There’s a lot of useful information right there! Also, you can click on any of the graphs next to the numbers in your GA dashboard to put that metric up into the large graph at the top of the screen.
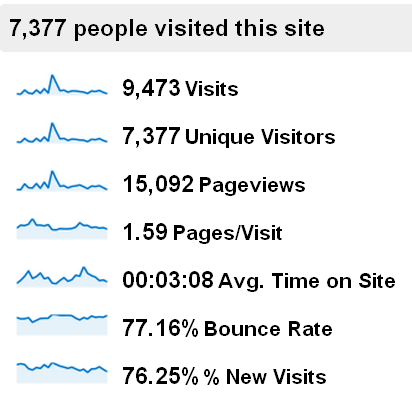
Let’s break it down:
9,473 Visits – This is the total number of visits to your website, including return visits.
7,377 Unique Visitors – The number of unique individuals who visited your site. This number will typically be smaller than the total visits, as some people will have visited more than once.
15,092 Pageviews – The total number of pages all visitors (including return visitors) looked at. Google defines a “pageview” as follows: “A pageview is defined as a view of a page on your site that is being tracked by the Analytics tracking code. If a visitor hits reload after reaching the page, this will be counted as an additional pageview. If a user navigates to a different page and then returns to the original page, a second pageview will be recorded as well.”
1.59 Pages/Visit – The average number of pageviews per visit.
00:03:08 Avg. Time on Site – The average length of time visitors stayed on your site. This number can be really disheartening for many, who might hope people are reading page after page when they visit. In truth, many people will surf to your site and stay for less than 10 seconds, depending upon what they’re looking for. Some folks will spend more time – this is just the average.
77.16% Bounce Rate – The percentage of site visitors who left your site after viewing only one page. This may not necessarily be a bad thing; if you’re posting the URL’s to a specific post to social media, many of your regular readers will click the link, read that page, and go someplace else. Some of these people, though, are folks who landed on your site, didn’t see what they were looking for, and left without exploring further. It’s possible, but not definite, a high bounce rate might indicate your site may not be very friendly to navigate, or is not visually appealing for a segment of the population. We advice not getting too het up about this number.
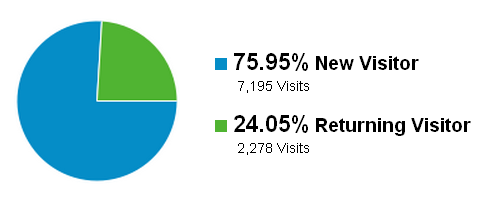
76.25% New Visits – The percentage of visits that had never been to your site before. Depending upon your goals, you may want this number to be higher (for businesses doing campaigns to gain new customers,) or lower (for bloggers encouraging a following.) It’s a useful metric, but nothing to get too worked up over if it’s not right where you want it to be. New visits mean new people are getting exposed to your content. Return visits mean people found something useful on your site in prior visits, so they came back. In our view, both are good.
Also on this page is the pie graph charting new vs. returning visitors:
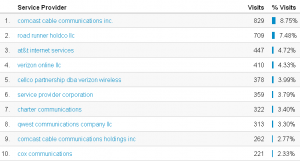
There are also Demographics stats, outlining what language the reader’s browser was set for, what country and city they were in, which browser, operating system and service provider they used, if they used a mobile device and what operating system, service provider, and screen resolution that mobile device used.
We will cover Advanced Segments on another day. For now, let’s go back to the Home screen and look at the Traffic Types chart, which is likely directly beneath the Daily Visits chart.
Traffic Types
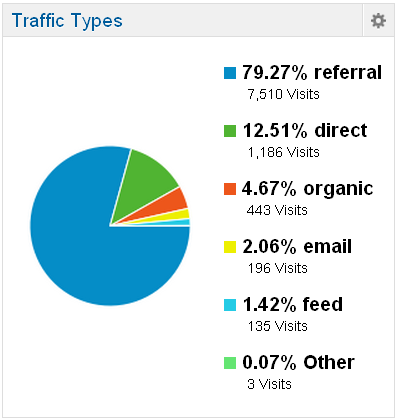
What’s all this? Is some of my traffic pesticide-free? Google has some good in-depth explanations of these terms, and we’ll nutshell them for you below:
79.27% referral (7,510 Visits) – The percentage (and number) of visitors who came to your site via a direct link from another site that is not a search engine. Examples are blogrolls, blog hops, recommended reading links, et cetera.
12.51% direct (1,186 Visits) – The percentage (and number) of visitors who typed your website’s URL directly into their web browser, or who used a bookmark.
4.67% organic (443 Visits) – The percentage (and number) of visitors who found your site via a search engine, who did not clink on a sponsored (paid-for) link or ad on that search engine. SEO experts sometimes refer to these searches as using “naturally-occurring search terms,” but we think that’s kind of silly.
2.06% email (196 Visits) – The percentage (and number) of visitors who came to your site by clicking on a link in their email. This can be useful to track newsletter campaigns.
1.42% feed (135 Visits) – The percentage (and number) of visitors who came to your site by clicking on a link in their RSS feed.
0.07% Other (3 Visits) – Generic traffic which did not fall into any other category.
Click on the Traffic Types title of this chart to open the Traffic Sources Overview.
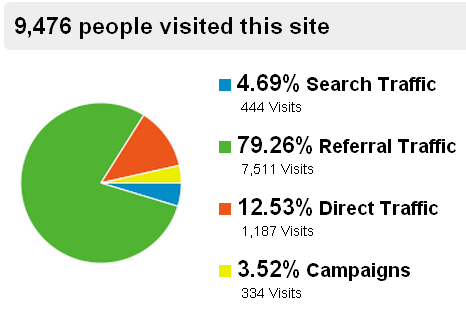
The main pie graph will change slightly to reflect different information:
Additional information we see here includes:
4.69% Search Traffic – How much traffic was driven to the site via search engines.
3.52% Campaigns – The traffic from defined “campaigns,” such as newsletters or advertisements. We’ll cover how to set these up later.
In the bottom half of the screen, there is additional information:
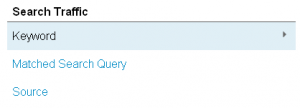
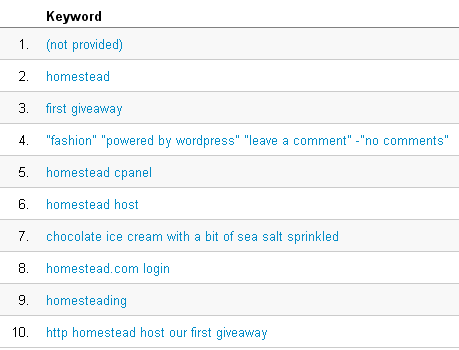
Keywords
The keyword search is most interesting for us, as it tells us what search terms presented our link to users of search engines. This list is a constant source of consternation and wonder:
This list can be useful, in addition to confusing. Why the fourth item is as popular as it is is utterly beyond us. One of the things about SEO is, when someone clicks on your link after performing a search, the search engine will add a point to your site’s relevance to that search, thereby increasing the likelihood of the link being presented to other people.
The keywords list does not really pertain to keywords you have set up on your site – it is only the search terms which brought people to the site. If you have an AdWords campaign going, you can potentially use this list in conjunction with other metrics to refine your ad-triggering keywords.
Matched Search Queries are related to AdWord campaigns, which is beyond the scope of this boot camp. There is a great blog post on this topic on Avinash’s blog.
The Source listing shows you which search engines are driving traffic to your site. If something other than Google is at the top of your list, we’d be dumbstruck.
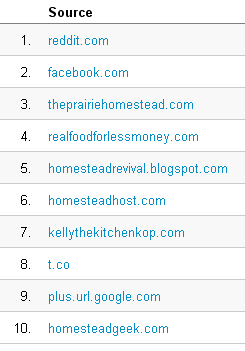 The Referral Traffic Source listing shows the top ten websites sending traffic to you (you can view more sites by clicking the “view full report” link in the bottom right corner.) You can see how social media sites can really be worth their salt, as they occupy the top two slots for this past month.
It’s always nice to know which websites have links to you, and to return the favor you could add a link back, whether in your blogroll list, or perhaps in a blog post. Cross-pollinating websites is a wonderful way to build community, and is a nice break from the competitive attitude some blogs take.
Let’s go back to the Home tab, and scroll to the bottom.
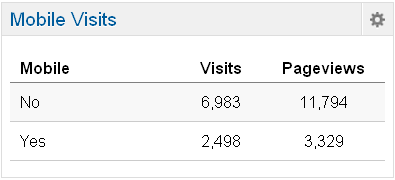
The bottom-most chart we have on our default Home tab is the Mobile Visits chart.
Clicking on the Mobile Visits title will take us into a kind of one-off, oddball screen, so we’re going to skip that for the time being. The main dashboard widget just gives you an idea as to whether mobile users are accessing your site, and whether you might want to consider that data in terms of website design.
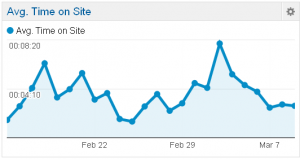
Average Time on Site
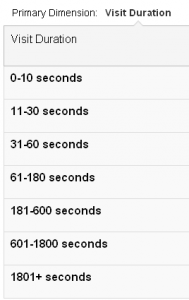
If the initial “Avg Time on Site” metric was disappointing, it may be advisable to sit down. By clicking on the title for this chart, you’ll open the Engagement Overview, and you’ll be able to see how many people spent less than 10 seconds on your site. This can be enough to make a blogger cry: After all, what good are 10,000 visits if they only stay for 5 seconds?
However, in addition to seeing those treacherous folks who spent less than 10 seconds on your site, you’ll see who stuck around to actually read your content:
Sometimes, seeing the number of folks who spent more than 180 seconds on our site makes us wish we knew who they were so we could send them a thank-you note. Those who spent 1801 or more seconds? We wish we could give them an award of some sort for their patience and willingness to read on.
For reference, 1800 seconds is 30 minutes – that’s some very quality browsing time, and demonstrates at least a few of your readers are really interested in your content.
![]()
How goes Google determine how long a visitor stayed on your site? It’s a bit complicated, but there’s a fairly good explanation on this site.
The other tab on the Engagement Overview is the Page Depth tab. This shows you how many pages readers viewed whilst on your site.
Let’s cruise back to the Home tab for just a few more items.
Time on Site by Country is exactly what you’d think – a list of countries, and their average time on your site. Clicking on the title takes you back to the same Engagement Overview screen, so we’ll skip that.
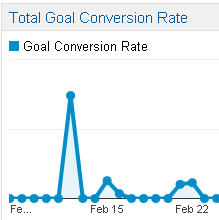
Total Goal Conversion Rate
Conversions are goals for your site, and can be configured to map to just about anything you like, be it newsletter subscriptions, sales, clicking your FaceBook Like button, and more. We’ll cover setting up Goals on another day. Clicking on the title for this chart takes you into the TGCR Overview screen, where you can get more metrics for your goals. We’ll cover those later on, too!
Customizing Your Dashboard
That’s all the standard stuff! Let’s talk briefly about customizing your dashboard.
Each chart (called a “widget”) has a little gear in its top right corner:
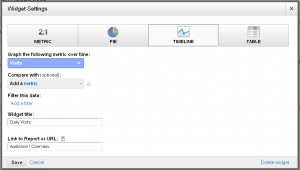
This brings up a Widget Settings screen, wherein you may customize the look and feel of that widget, or remove it from your dashboard. You can select the type of graph you want to see, select which metric it should be tracking (the list is long,) compare it with another metric, add filters, and more.
You can also add widgets to your dashboard by clicking, oddly enough, the +ADD WIDGET button at the top right of your screen.
This will bring up a screen nearly identical to the Widget Settings screen, wherein you can add any sort of widget you like.

You can also add more dashboards, which have different information readily displayed by clicking on the Dashboards button on the left, and then clicking +New Dashboard beneath it.
You can start with a Blank Canvas or another Starter Dashboard, which will have the standard widgets already in place.
Dashboard configurations you add can be shared with others by clicking the SHARE DASHBOARD button; however, this will only share the widget configuration, and not your site’s statistics.
That’s all for today!
We’ve shown you how to set up Google Analytics, how to set up Webmaster Tools, and how to make sense of the basic information on your Dashboard. There is a lot more to share with you, so stay tuned!
The next session will cover possibly the most exciting aspect of GA – Real-Time Tracking, which allows you to see visitors clicking around your website in real-time. It is so cool! Sometimes, we just sit and watch it for awhile.
If you have any questions or feedback about today’s boot camp, please let us know in the comments; we’d love to hear your thoughts.
We’ll see you soon, and thanks for reading!


